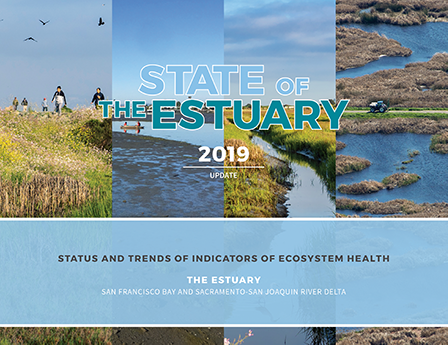
The State of Our Estuary
The State of Our Estuary
2019 Report
2015 Report

Recognizing the Estuary’s importance, state and regional government agencies have developed common goals to improve its health. The State of Our Estuary shows progress toward these goals by summarizing the status and trends for 24 indicators grouped into five categories representing ecosystem health: Clean Water, Quality Habitat, Resilient Processes, Flourishing Wildlife, and Thriving Communities. The indicator pages provide detailed information on the findings, including technical appendices that document the methods and analytical approaches.
The State of Our Estuary is now a dynamic website. To visit our new site, click on Our Estuary.
State of the Estuary 2019
Status and Trends of Indicators of Ecosystem Health
The projects we manage and the people and species they affect are all one, and we must recognize and work through the complexities. It will take much more than measures of acreage, elevation, and access to sustain California’s ecosystems and residents in the future.
We need more investment in creative ways to use and restore flows for environmental health, to expand and build resilient shorelines with rising land elevations, and to weave considerations of social equity more strongly into efforts to improve environmental health.
Technical Appendices
Review the technical materials associated with this report that were gathered, produced, and reviewed by subject-matter experts.
Download the Combined Technical Appendices for the 2019 State of the Estuary Report
Credits and Acknowledgements
Science Coordination
April Robinson,
San Francisco Estuary Institute
Science Lead
J. Letitia Grenier,
San Francisco Estuary Institute
Contributing Scientists
Freshwater Flows
Christina Swanson,
Natural Resources Defense Council
Beneficial Floods
Christina Swanson,
Natural Resources Defense Council
Tidal Marsh Extent
Emily Clark,
Sam Safran,
San Francisco Estuary Institute
Fish
Christina Swanson,
Natural Resources Defense Council
Jon Rosenfield,
The Bay Institute/Bay Keeper
Bill Bennett,
The Bay Institute
Urban Water Use
Peter Vorster,
Greg Reis,
The Bay Institute
Urban Green Space
Matt Benjamin,
Sam Safran,
Erica Spotswood,
San Francisco Estuary Institute
Nature-based Shorelines
Katie McKnight,
Sam Safran,
Julie Beagle,
San Francisco Estuary Institute
Elevation
Matt Benjamin,
Sam Safran,
San Francisco Estuary Institute
Steering Committee
Caitlin Sweeney,
Liz Juvera,
San Francisco Estuary Partnership
Martina Koller,
John Callaway
Delta Stewardship Council
Luisa Valiela,
U.S. Environmental Protection Agency
Copyediting
Ariel Rubissow Okamoto,
Lisa Owens Viani
VOICES sections draw from ESTUARY News Magazine stories with additional research by Aleta George and Audrey Mei Yi Brown.
Design
Miguel A. Osorio, Layout Design
Peter Beeler, Estuary Map
Metropolitan Transportation Commission
Printer
JT Litho,
Oakland, California
Printed on Recycled Paper
Online Materials
Tony Hale,
San Francisco Estuary Institute
Cover Photos
Left to right: Shira Bezalel; Don Yee; Shira Bezalel; Ken James
Website Video
Andy Miller,
Plus M Productions
Acknowledgements
This report was funded by the San Francisco Estuary Partnership and the Delta Stewardship Council.
We would like to thank the many people who contributed to the development and review of this report, including: Ruth Askevold, Josh Bradt, Gary Bobker, Amanda Bohl, Josh Collins, Will Dominie, Liz Duffy, Cristina Grosso, Kathy Hieb, Nahal Ipakchi, Jessica Law, Jeremy Lowe, Darcie Luce, Ron Melcer, Thomas Mumley, Heidi Nutters, Ellen Plane, Sandra Scoggin, Tim Smith, and Christina Toms.
State of the Estuary 2015
Enjoy the full 2015 State of the Estuary Report, or read the Executive Summary.
If you wish to take the report “to go,” then a PDF offers the best form for printing and emailing.
The Report in Motion
A Video Summary
Technical Appendices
For the report indicators, our science contributors developed individual technical appendices, which you will find embedded in the above “Summary of Estuary Health 2015.” If it interests you, we also feature a comprehensive collection of all appendices.
Credits and Acknowledgements
Science Coordination
April Robinson,
San Francisco Estuary Institute
Science Lead
J. Letitia Grenier,
San Francisco Estuary Institute
Contributing Scientists
Freshwater Flows
Christina Swanson,
Natural Resources Defense Council
Beneficial Floods
Christina Swanson,
Natural Resources Defense Council
Tidal Marsh Extent
Emily Clark,
Sam Safran,
San Francisco Estuary Institute
Fish
Christina Swanson,
Natural Resources Defense Council
Jon Rosenfield,
The Bay Institute/Bay Keeper
Bill Bennett,
The Bay Institute
Urban Water Use
Peter Vorster,
Greg Reis,
The Bay Institute
Urban Green Space
Matt Benjamin,
Sam Safran,
Erica Spotswood,
San Francisco Estuary Institute
Nature-based Shorelines
Katie McKnight,
Sam Safran,
Julie Beagle,
San Francisco Estuary Institute
Elevation
Matt Benjamin,
Sam Safran,
San Francisco Estuary Institute
Steering Committee
Caitlin Sweeney,
Liz Juvera,
San Francisco Estuary Partnership
Martina Koller,
John Callaway
Delta Stewardship Council
Luisa Valiela,
U.S. Environmental Protection Agency
Copyediting
Ariel Rubissow Okamoto,
Lisa Owens Viani
VOICES sections draw from ESTUARY News Magazine stories with additional research by Aleta George and Audrey Mei Yi Brown.
Design
Miguel A. Osorio, Layout Design
Peter Beeler, Estuary Map
Metropolitan Transportation Commission
Printer
JT Litho,
Oakland, California
Printed on Recycled Paper
Online Materials
Tony Hale,
San Francisco Estuary Institute
Cover Photos
Left to right: Shira Bezalel; Don Yee; Shira Bezalel; Ken James
Website Video
Andy Miller,
Plus M Productions
Acknowledgements
This report was funded by the San Francisco Estuary Partnership and the Delta Stewardship Council.
We would like to thank the many people who contributed to the development and review of this report, including: Ruth Askevold, Josh Bradt, Gary Bobker, Amanda Bohl, Josh Collins, Will Dominie, Liz Duffy, Cristina Grosso, Kathy Hieb, Nahal Ipakchi, Jessica Law, Jeremy Lowe, Darcie Luce, Ron Melcer, Thomas Mumley, Heidi Nutters, Ellen Plane, Sandra Scoggin, Tim Smith, and Christina Toms.
